
Project Plan
Abstract
This exploratory visualization will allow me to quickly see and evaluate student masteries of standards within a course. As an educator, I will be using this tool to help plan and prepare for upcoming courses; I can spend less time on topics that students have shown proficiency in, and spend more time reviewing topics that students are struggling with.
Possible extensions to this visualization include cumulative views for courses, student views, and the ability to edit the dataset by interacting with the visualization.
Architecture
After considering the time constraints, I decided to use D3 for this visualization; if this prototype goes well, I am considering switching to another framework for future iterations.
The core of this visualization is the group; everything else is simply used to select and filter the standards that will be shown. State and event handlers will be written accordingly.
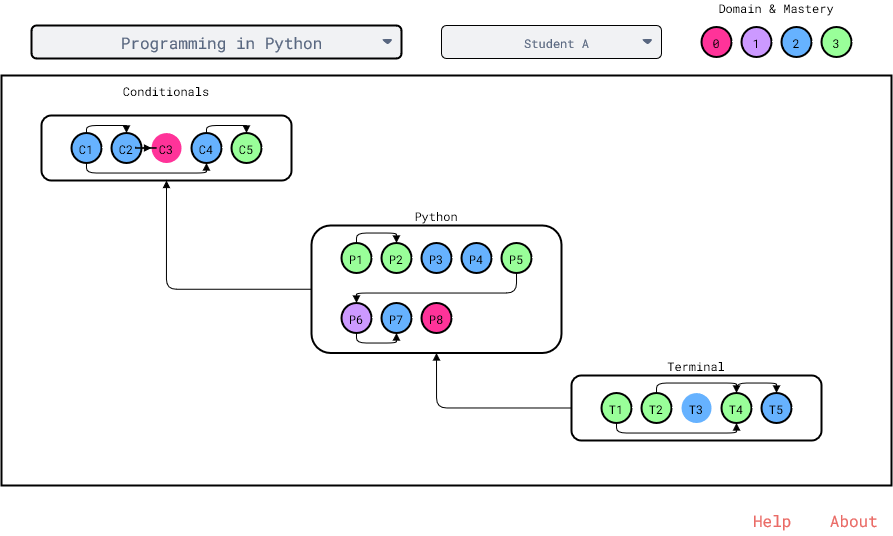
Final Sketch
After discussing with my peers, I decided to stay with my initial sketches and get a working prototype up and running – feedback will be more helpful once I run into more issues.
Data
The data that I am using for this visualization is collected from the courses that I am currently teaching. However, to protect the privacy of my students, the public version of this visualization will be created with anonymized data.