The October Storytelling with Data challenge is to find and visualize a dataset using a scatterplot. Scatterplots are a good way to visualize how two dimensions of a dataset are related. In addition to just plotting the points, however, a scatterplot can be highlighted in certain ways to make the message stronger. For example, the average point can be made bold, or the plot can be divided into different sections. This will be good practice for me in taking a dataset and trying to visualize it.
I decided to use the College Scorecard database, which is maintained by the U.S. Department of Education and contains information about colleges.
I want to look at the relationship between student household income and the cumulative median debt (amount of money that the student owes after graduation) for 2015-16. For each college, the dataset provides the median cumulative debt for three income brackets ($0-30k, $30k-75k, $75k+). I would have liked more granular income brackets, but this data should still be enough to give a general sense of the relationship between these two measures.
My intuition is that these two measures are negatively correlated. If a college does not offer great financial aid, a family with fewer resources will be urged to borrow more money to pay tuition. I hope that using a scatterplot to visualize this data will confirm my intuition. If it doesn’t, then some questions for me to consider are:
I am using seaborn to construct the scatterplot, and here is my code.
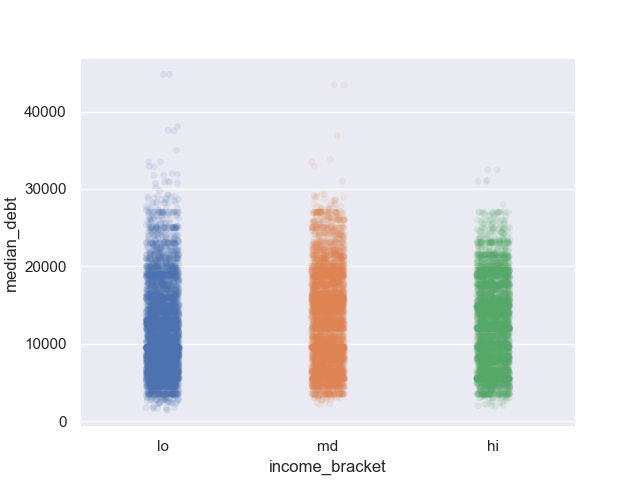
Before constructing the scatterplot, I retrieve only the measures I want: LO_INC_DEBT_MDN, MD_INC_DEBT_MDN, HI_INC_DEBT_MDN. I then use those to create a new dataset where each point has the form (income bracket, debt). I pass this new dataset into seaborn to create the scatterplot, with income as the x-axis and debt as the y-axis. Since the x-axis is categorical, I used a strip-plot – that is, a scatterplot with jitter applied so that we can better see the distribution of data points.
Upon creating these scatterplots, however, we find that with the exception of a few outliers, we don’t see that much of a difference between the distribution of median cumulated debts between the different income levels! A scatterplot may not be the best choice for this dataset after all, especially since there are so many points, and the dataset provided only three income brackets instead of the actual household incomes. It’s very difficult to see the distribution of debt because there are too many points in such a confined space.
The scatterplot may be more informative if there were more income brackets, but takeaway for future datasets is:
Think about what the chart would look like before you do all this work!
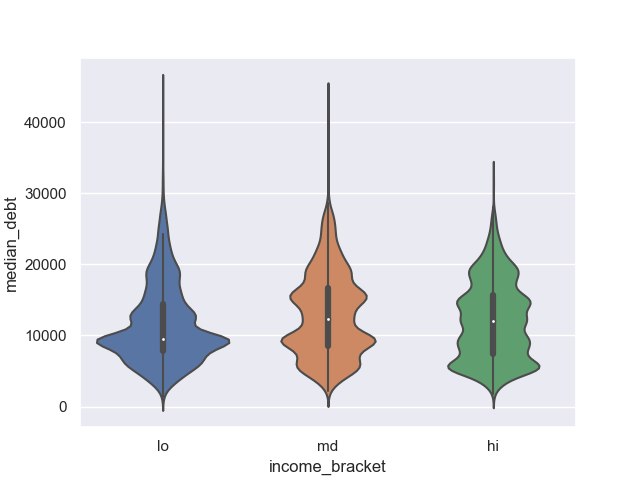
Violin plots show a lot more information about the dataset than the scatterplots. Here, the intuition is that the distributions of median cumulative debt between different income brackets aren’t that different! This intuition can be confirmed by running statistical tests on the dataset, but these visualizations do make me want to rethink my initial assumption: that the lower income bracket would have higher median debt.
This may mean that overall, colleges are doing a good job of providing financial aid to students that need it, as it seems that students end up borrowing similar amounts of money regardless of their income level. It is important to note that these visualizations show distributions of medians. Each data point is median debt for a particular institution. As a result, we are seeing a summarization of summarizations. Perhaps it would be more enlightening to analyze the relationship between student household income and cumulative debt for individual instutions. The Department of Education also acknowledges that most of their data comes from students who receive federal grants and loans, which is likely to skew the data.
What’s also shocking is that these charts suggest that most undergraduate students are graduating thousands, if not tens of thousands, of dollars in debt! That’s so much money! This is a small part of a much larger discussion on the price of higher education in the United States.
Reading violin plots + examples